The Suwannee Guide
Weather: Use these links to access the National Weather Service stations and radar
loops. These are very simple and to the point mobile versions.
SUN and MOON: Monthly Sunrise/set and Moonrise/set times for the vicinity of Live Oak, FL. Follow the link to the right for a monthly schedule. Advance the month through links at the bottom of the calendar.
Ellaville, FL
Flood Stage: 54'
High: 50.19' / April 8,1948
Low: 28.33' / October 6, 2011
Mean: 33.8'
Source: USGS / Suwannee River Water Management District
Luraville, FL
Flood Stage: 37'
High: 50.19' / August 24,1928
Low: 16.89' / January 16, 2012
Mean: 22.2'
Source: USGS / Suwannee River Water Management District
Suwannee Springs, FL
Flood Stage: 67'
High: 71.30' / October 6, 2004
Low: 35.88' / September 19, 2011
Mean: 41.5'
Source: USGS / Suwannee River Water Management District
White Springs, FL
Flood Stage: 77'
High: 88.54' / April 10, 1973
Low: 48.75' / July 12, 1981
Mean: 55.7'
Source: USGS / Suwannee River Water Management District
Dowling Park, FL
Flood Stage: 50'
High: 54.95' / April 12, 2009
Low: 20.84' / January 16, 2012
Mean: 26.2'
Source: USGS / Suwannee River Water Management District
Benton (CR 6), FL
Flood Stage: 94'
High: 88.54' / April 10, 1973
Low: 73.91' / July 7, 2011
Mean: 79.0'
Source: USGS / Suwannee River Water Management District
Fargo, GA
Flood Stage: 101.9'
High: 110.61' / October 3, 2004
Low: 91.84' / July 9, 2011
Mean: 96.4'
Source: USGS / Suwannee River Water Management District
Jennings, FL
Flood Stage: 83.5'
High: 93.89' / April 8,2009
Low: 61.27' / October 10, 2006
Mean: 65.4'
Source: USGS / Suwannee River Water Management District
SR 6 at Blue Springs, FL
Flood Stage: Not established
High: 75.68' / April 8, 2009
Low: 40.36' / January 16, 2012
Mean: 43.6'
Source: USGS / Suwannee River Water Management District
Branford, FL
Flood Stage: 29'
High: 38.84' / April 11,1948
Low: 6.50' / May 27, 2012
Mean: 13.8'
Source: USGS / Suwannee River Water Management District
Rock Bluff, FL
Flood Stage: Not established
High: 30.91' / April 13,1948
Low: 3.68' / November 6, 2011
Mean: 9.4'
Source: USGS / Suwannee River Water Management District
Wilcox, FL
Flood Stage: 11'
High: 21.79' / April 14,1948
Low: -1.08' / September 15, 1999
Mean: 4.6'
Source: USGS / Suwannee River Water Management District
Manatee Springs, FL
Flood Stage: 10'
High: 10.45' / April 20, 2009
Low: -1.09' / January 3, 2008
Mean: 2.7'
Source: USGS / Suwannee River Water Management District
Fowlers Bluff, FL
Flood Stage: 5.5'
High: 6.94' / April 20, 2009
Low: -0.94' / January 3, 2008
Mean: 1.6'
Source: USGS / Suwannee River Water Management District
Suwannee River, FL
Flood Stage: Not established
High: NA
Low: NA
Mean: 1.6'
Source: USGS / Suwannee River Water Management District
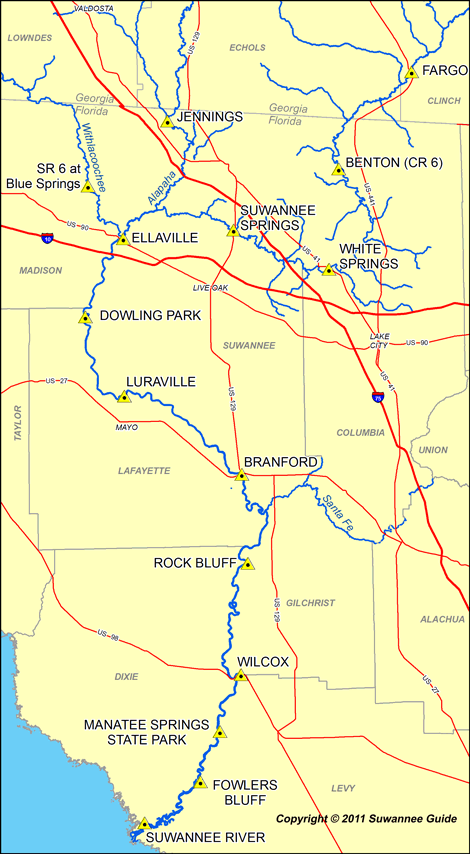
River-Levels (Suwannee River Water Management District links):
Click on the map station name for station information and levels from the past 30 days.
Go directly to the District River Level page.
The most informative station on the Suwannee is at Ellaville. The upstream influences of the Withlacoochee and Alapaha Rivers greatly affect the overall conditions for much of the Suwannee while the Okeefenokee Swamp serves as a natural buffer to fluctuations in flow and water quality for the Upper Suwannee. Downstream tributaries from a different part of the Suwannee River basin may receive more rainfall than others and may affect upstream levels.
When the Ellaville station is close to 30 ft (above sea level), conditions for canoeing and camping along the river are generally ideal.
High-flow conditions from the Withlacoochee and/or Alapaha greatly increase the turbidity (silt and clay particles) and result in a muddy appearance. Higher flow from the Upper Suwannee can increase turbidity to a lesser degree but results in a higher influx of tannins that darken the appearance of the river.